Dubrovnik Sea Temperature
Average Monthly Dubrovnik Sea Temperatures (°C )
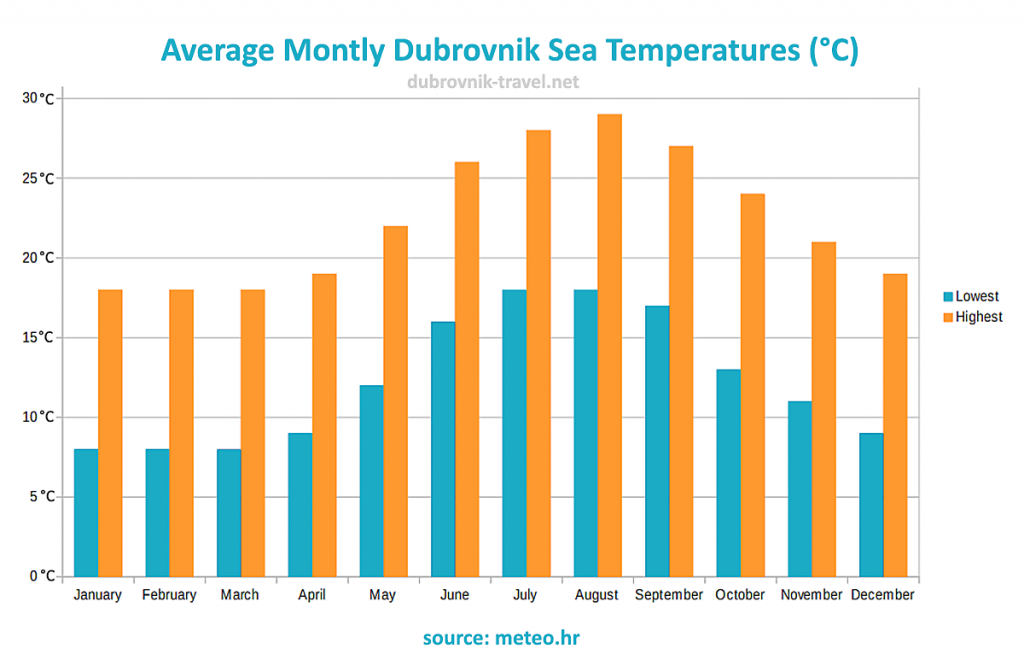
Monthly Dubrovnik Water Temperatures
Here is a year’s overview of the sea temperature month by month:
| Lowest ( °C ) | Lowest ( °F ) | Highest ( °C ) | Highest ( °F ) | |
| January | 8°C | 46.4 °F | 18°C | 64.4 °F |
| February | 8°C | 46.4 °F | 18°C | 64.4 °F |
| March | 8 °C | 46.4 °F | 18°C | 64.4 °F |
| April | 9 °C | 48.2 °F | 19°C | 66.2 °F |
| May | 12 °C | 53.6 °F | 22°C | 71.6 °F |
| June | 16°C | 60.8 °F | 26°C | 78.8 °F |
| July | 18°C | 64.4 °F | 28°C | 82.4 °F |
| August | 18°C | 64.4 °F | 29°C | 84.2 °F |
| September | 17°C | 62.6 °F | 27°C | 80.6 °F |
| October | 13°C | 55.4 °F | 24°C | 75.2 °F |
| November | 11°C | 51.8 °F | 21°C | 69.8 °F |
| December | 9 °C | 48.2 °F | 19°C | 66.2 °F |
source: seawater temperatures by Državni hidrometeorološki zavod meteo.hr
An overview of monthly seawater temperatures on a sea surface for Dubrovnik, Croatia. Graph and figures for average lowest and average highest sea temperatures in °C and °F.
Due to the weather, the maximum water temperature occurs at 3 pm local time and the minimum occurs at 5 am. The daily temperature amplitude is just 1.1 ° C and indicates little change during the day.

 Subscribe